test> python ..\optimize_decay.py clean
ファイルを削除するかどうか聞いてくるので、
・ すべて削除する場合は all
・ 聞かれているファイル群だけ削除する場合は yes
・ 削除しない場合は no
を入力し、ENTERを押す
実行に必要なファイル: decay.xlsx
test> python ..\optimize_decay.py init --ntau=5
initの前段でcleanを実行するため、1と同じことを聞かれるので、all/yes/noを回答する。
緩和時間の数 ntau を引数で与え、時系列データからτの最大値、最小値を見積もり、緩和時間の対数で均一に分布するように
τの初期値を決める。
線形最小二乗法により、係数の初期値を決定する。
出力例(抜粋):
Linear least-sqaures fitting:
minimize_func.read_input_data(): Read input data from [D:/yoshikawa-sigmaph.xlsx]
Linear variables:
varname : ['bg_c0', 'I01', 'I02', 'I03', 'I04', 'I05']
optid : [1, 1, 1, 1, 1, 1]
fitting parameters: [0.0, 0.0, 0.0, 0.0, 0.0, 0.0]
constants:
tau: None 1.216 3.822 12.01 37.77 118.7
mlsq_general_optid:
nvars = 6
nmatrix = 6
ai = 0 0 0 0 0 0
linid = 1 1 1 1 1 1
matrix index= 0 1 2 3 4 5
nData = 51
optimiz_mup.mslq_general3:: Vector and Matrix:
Si = 5.781e-06, 6.845e-07, 1.116e-06, 2.119e-06, 3.724e-06, 4.946e-06
Sij= 51, 1.784, 4.344, 12.34, 28.35, 41.63
1.784, 1.239, 1.511, 1.679, 1.748, 1.772
4.344, 1.511, 2.454, 3.428, 3.995, 4.225
12.34, 1.679, 3.428, 6.52, 9.588, 11.31
28.35, 1.748, 3.995, 9.588, 18.09, 24.24
41.63, 1.772, 4.225, 11.31, 24.24, 34.51
ai(new)= -1.05e-06, 5.118e-07, -4.144e-07, 7.909e-07, -1.711e-06, 2.377e-06
ai(org)= 0, 0, 0, 0, 0, 0
ai_all= -1.05e-06, 5.118e-07, -4.144e-07, 7.909e-07, -1.711e-06, 2.377e-06
linear fit results:
varname : bg_c0 I01 I02 I03 I04 I05
ai_new : -1.05e-06 5.118e-07 -4.144e-07 7.909e-07 -1.711e-06 2.377e-06
ai_all : -1.05e-06 5.118e-07 -4.144e-07 7.909e-07 -1.711e-06 2.377e-06
optid_lin : 1 1 1 1 1 1
all parameters:
varname : bg_c0 I01 tau1 I02 tau2 I03 tau3 I04 tau4 I05 tau5
fit.pk(org) : 0 0 1.216 0 3.822 0 12.01 0 37.77 0 118.7
pk_all(new) : -1.05e-06 5.118e-07 1.216 -4.144e-07 3.822 7.909e-07 12.01 -1.711e-06 37.77 2.377e-06 118.7
Save configuration parameters to [D:\yoshikawa-sigmaph.in]
Error in tkfile.open(): [D:\yoshikawa-sigmaph.in] does not exist
Warning in tkinifile.WriteString: Can not read [D:\yoshikawa-sigmaph.in]
Save fitting parameters to [D:\yoshikawa-sigmaph_parameters.csv] (save_parameters)
time at startup: 24/11/20 06:28:59
time at end: 24/11/20 06:29:00
Elapsed time from startup to end: 1.4424 sec
作成されるファイル:
注:
一部の係数が負になっているが、decay.pyでは負の係数は物理的にあり得ない
test> python ..\optimize_peakfit1.py plot

入力データとシミュレーション結果をプロットする
test> python ..\optimize_decay.py sim
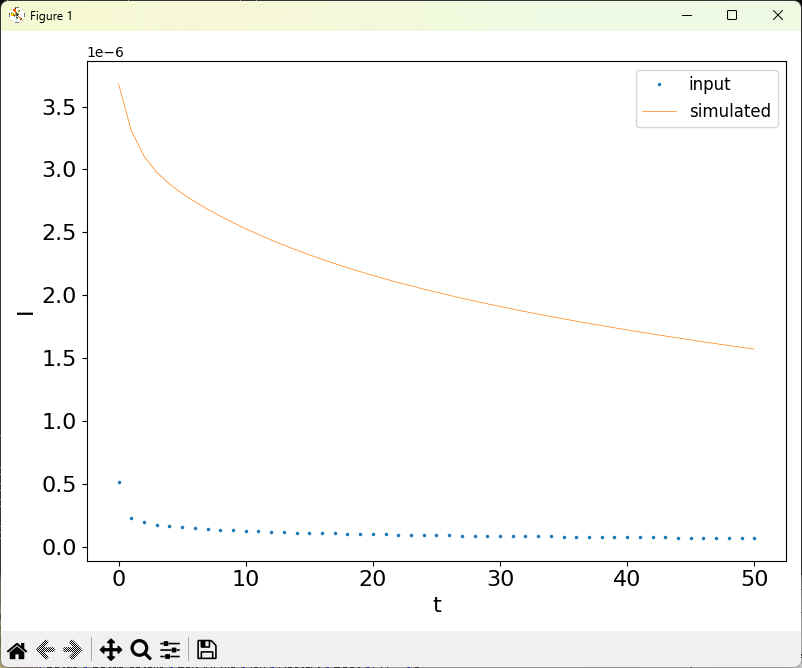
注: この場合は、一部の係数が負になっているため、sim、fitモードでは、それらの係数を0として計算する。
そのため、inputとsimulatedに大きな乖離がある
4.のsimでみたようにのように、負の係数のように許容されない値があると、inputとsimulateに大きな違いがある。
このような場合は、--mode=fitlp により、線形回帰可能な係数 (lined=1) のみで非線形最小二乗法を行います。
注意: 4.でsimulation結果が良い場合は、直接7.のfitを行います
test> python ..\optimize_decay.py fitlp
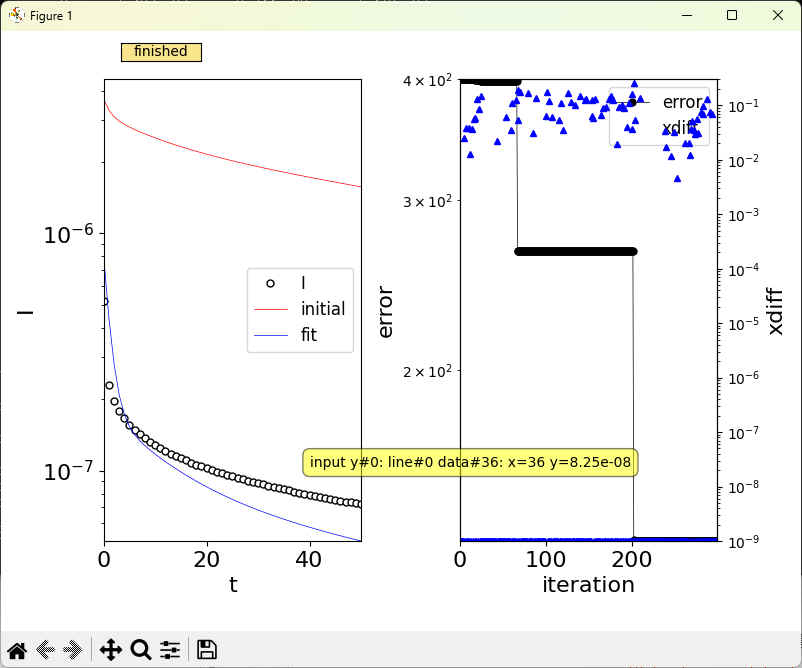
コンソール出力 (peaks-out.txt):
Final parameters:
00: bg_c0= 0 (id=1) (linear=1) penality: 1 * (0 - 1e+10)
01: I01= 6.13216e-07 (id=1) (linear=1) penality: 1 * (0 - 1e+10)
02: tau1= 1.2158 (id=0) (linear=0) penality: 1 * (1e-15 - 1e+10)
03: I02= 1.1118e-09 (id=1) (linear=1) penality: 1 * (0 - 1e+10)
04: tau2= 3.82196 (id=0) (linear=0) penality: 1 * (1e-15 - 1e+10)
05: I03= 9.59889e-08 (id=1) (linear=1) penality: 1 * (0 - 1e+10)
06: tau3= 12.0146 (id=0) (linear=0) penality: 1 * (1e-15 - 1e+10)
07: I04= 1.69584e-08 (id=1) (linear=1) penality: 1 * (0 - 1e+10)
08: tau4= 37.7688 (id=0) (linear=0) penality: 1 * (1e-15 - 1e+10)
09: I05= 6.77671e-08 (id=1) (linear=1) penality: 1 * (0 - 1e+10)
10: tau5= 118.729 (id=0) (linear=0) penality: 1 * (1e-15 - 1e+10)
fmin= 0.37532691764651843
Save configuration parameters to [D:\yoshikawa-sigmaph.in]
Save fitting parameters to [D:\yoshikawa-sigmaph_parameters.csv] (save_parameters)
(i) tauのoptidを0に、係数のoptidのみを1にして係数だけのフィッティングを行う。
decay_parameters.csv
| varname | unit | pk_scale | optid | linid | pk | dx | kmin | kmax | kpenalty |
| bg_c0 | 1 | 1 | -1.05E-06 | 5.20E-09 | 0 | 1.00E+10 | 1 | ||
| I01 | 1 | 1 | 5.12E-07 | 5.20E-08 | 0 | 1.00E+10 | 1 | ||
| tau1 | 0 | 0 | 1.2158 | 0.12158 | 1.00E-15 | 1.00E+10 | 1 | ||
| I02 | 1 | 1 | -4.14E-07 | 5.20E-08 | 0 | 1.00E+10 | 1 | ||
| tau2 | 0 | 0 | 3.821957 | 0.382196 | 1.00E-15 | 1.00E+10 | 1 | ||
| I03 | 1 | 1 | 7.91E-07 | 5.20E-08 | 0 | 1.00E+10 | 1 | ||
| tau3 | 0 | 0 | 12.0146 | 1.20146 | 1.00E-15 | 1.00E+10 | 1 | ||
| I04 | 1 | 1 | -1.71E-06 | 5.20E-08 | 0 | 1.00E+10 | 1 | ||
| tau4 | 0 | 0 | 37.76875 | 3.776875 | 1.00E-15 | 1.00E+10 | 1 | ||
| I05 | 1 | 1 | 2.38E-06 | 5.20E-08 | 0 | 1.00E+10 | 1 | ||
| tau5 | 0 | 0 | 118.7288 | 11.87288 | 1.00E-15 | 1.00E+10 | 1 |
test> python ..\optimize_decay.py fit
(ii) tauのoptidを 1 に戻す
decay_parameters.csv
varname
unit
pk_scale
optid
linid
pk
dx
kmin
kmax
kpenalty
bg_c0
1
1
0
5.20E-09
0
1.00E+10
1
I01
1
1
6.13E-07
5.20E-08
0
1.00E+10
1
tau1
1
0
1.2158
0.12158
1.00E-15
1.00E+10
1
I02
1
1
1.11E-09
5.20E-08
0
1.00E+10
1
tau2
1
0
3.82196
0.382196
1.00E-15
1.00E+10
1
I03
1
1
9.60E-08
5.20E-08
0
1.00E+10
1
tau3
1
0
12.0146
1.20146
1.00E-15
1.00E+10
1
I04
1
1
1.70E-08
5.20E-08
0
1.00E+10
1
tau4
1
0
37.7688
3.77688
1.00E-15
1.00E+10
1
I05
1
1
6.78E-08
5.20E-08
0
1.00E+10
1
tau5
1
0
118.729
11.8729
1.00E-15
1.00E+10
1
フィッティング (Launcher:Decay:[nonlinear
fit]): 全パラメータで非線形最小二乗法を実行する
test> python ..\optimize_decay.py fit
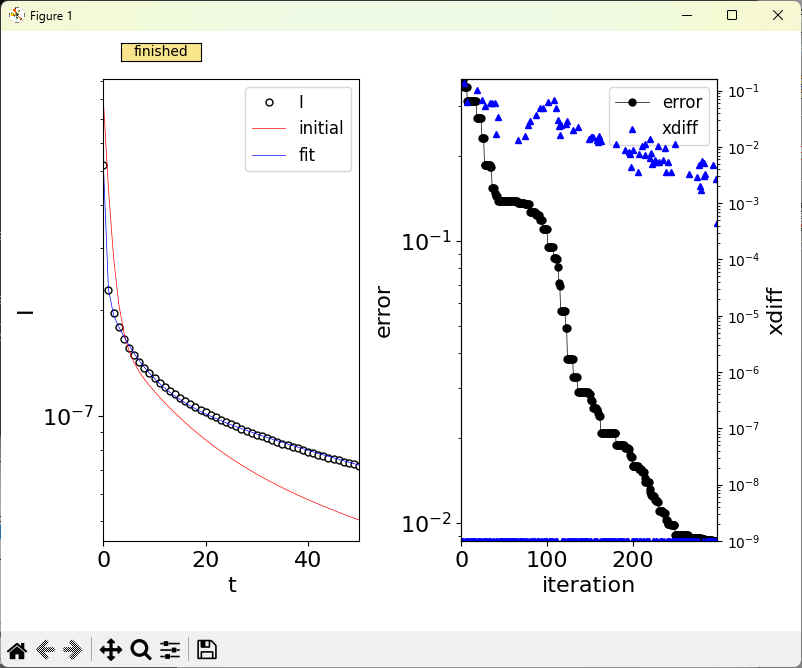
コンソール出力:
Final parameters:
00: bg_c0= 1.60874e-08 (id=1) (linear=1) penality: 1 * (0 - 1e+10)
01: I01= 2.95598e-07 (id=1) (linear=1) penality: 1 * (0 - 1e+10)
02: tau1= 0.385099 (id=1) (linear=0) penality: 1 * (1e-15 - 1e+10)
03: I02= 4.28512e-08 (id=1) (linear=1) penality: 1 * (0 - 1e+10)
04: tau2= 5.84325 (id=1) (linear=0) penality: 1 * (1e-15 - 1e+10)
05: I03= 5.86409e-08 (id=1) (linear=1) penality: 1 * (0 - 1e+10)
06: tau3= 5.78897 (id=1) (linear=0) penality: 1 * (1e-15 - 1e+10)
07: I04= 5.41549e-08 (id=1) (linear=1) penality: 1 * (0 - 1e+10)
08: tau4= 52.2003 (id=1) (linear=0) penality: 1 * (1e-15 - 1e+10)
09: I05= 5.27982e-08 (id=1) (linear=1) penality: 1 * (0 - 1e+10)
10: tau5= 125.93 (id=1) (linear=0) penality: 1 * (1e-15 - 1e+10)
fmin= 0.008608171905248157
Save configuration parameters to [D:\yoshikawa-sigmaph.in]
Save fitting parameters to [D:\yoshikawa-sigmaph_parameters.csv] (save_parameters)
Final data:
t I initial final
0 5.204e-07 7.95e-07 5.201e-07
2 1.968e-07 2.83e-07 1.938e-07
4 1.66e-07 1.728e-07 1.684e-07
6 1.487e-07 1.418e-07 1.509e-07
8 1.369e-07 1.274e-07 1.377e-07
10 1.281e-07 1.173e-07 1.277e-07
12 1.21e-07 1.09e-07 1.2e-07
14 1.152e-07 1.019e-07 1.139e-07
16 1.103e-07 9.569e-08 1.089e-07
18 1.061e-07 9.023e-08 1.048e-07
20 1.023e-07 8.542e-08 1.013e-07
22 9.903e-08 8.116e-08 9.826e-08
24 9.599e-08 7.737e-08 9.555e-08
26 9.331e-08 7.399e-08 9.31e-08
28 9.078e-08 7.095e-08 9.085e-08
30 8.847e-08 6.82e-08 8.876e-08
32 8.633e-08 6.572e-08 8.679e-08
34 8.435e-08 6.345e-08 8.492e-08
36 8.25e-08 6.138e-08 8.314e-08
38 8.075e-08 5.947e-08 8.143e-08
40 7.91e-08 5.77e-08 7.979e-08
42 7.757e-08 5.606e-08 7.821e-08
44 7.608e-08 5.454e-08 7.668e-08
46 7.47e-08 5.31e-08 7.52e-08
48 7.338e-08 5.176e-08 7.377e-08
50 7.212e-08 5.048e-08 7.238e-08
Save input, initial, and final data to [decay-fit.xlsx]
十分に収束するまで、フィッティング (Launcher:Decay:[nonlinear
fit]) を繰り返す。
必要があれば decay_parameters.csv の値 (pk)
を修正したり、一部パラメータを固定 (optid=0)
したりして
最適解を求める。
test> python ..\optimize_decay.py error
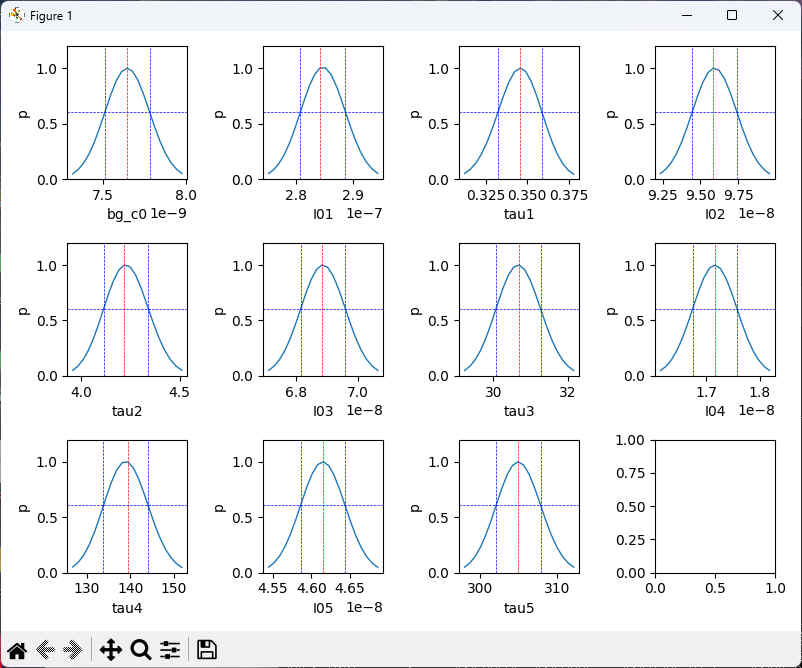
コンソール出力 (peaks-out.txt):
Accuracy within one sigma:
000: bg_c0 : 7.64378e-09 -1.332e-10 + 1.364e-10 in ( 7.51062e-09 - 7.78014e-09)
001: I01 : 2.84134e-07 -3.389e-09 + 4.518e-09 in ( 2.80745e-07 - 2.88652e-07)
002: tau1 : 0.345815 -0.01336 + 0.01296 in ( 0.332455 - 0.358775)
003: I02 : 9.58575e-08 -1.399e-09 + 1.562e-09 in ( 9.4458e-08 - 9.74194e-08)
004: tau2 : 4.21931 -0.1037 + 0.1222 in ( 4.11562 - 4.3415)
005: I03 : 6.88338e-08 -6.84e-10 + 7.552e-10 in ( 6.81497e-08 - 6.9589e-08)
006: tau3 : 30.6855 -0.6155 + 0.5774 in ( 30.07 - 31.2629)
007: I04 : 1.7165e-08 -4.184e-10 + 4.068e-10 in ( 1.67466e-08 - 1.75717e-08)
008: tau4 : 139.371 -5.565 + 4.689 in ( 133.806 - 144.06)
009: I05 : 4.61545e-08 -2.969e-10 + 2.829e-10 in ( 4.58577e-08 - 4.64374e-08)
010: tau5 : 304.924 -2.832 + 2.936 in ( 302.092 - 307.859)
test> python ..\optimize_decay.py lasso
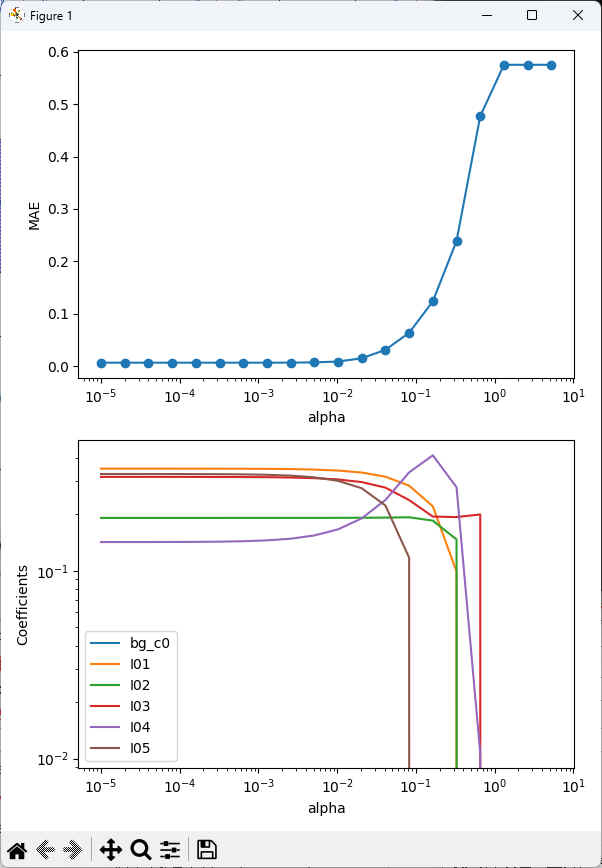
下のグラフから、正則化定数αを増やしていくと、I05,I01,I02の順番で係数が0になることがわかる。
これらが本当に不要かどうかは、これらの係数を 0、optid=0にしてフィッティングし、その結果を見て判断する。