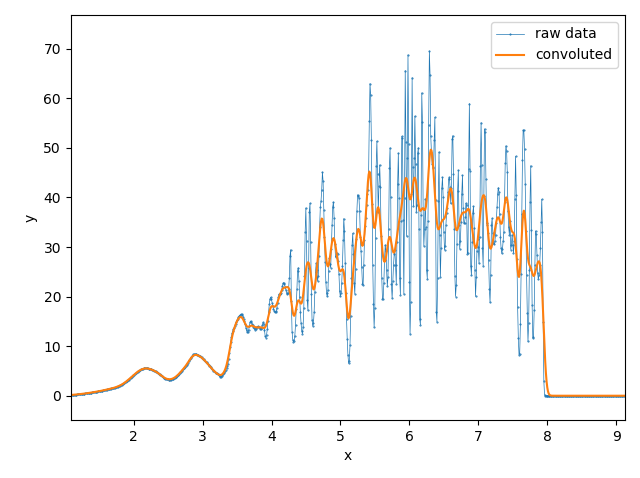
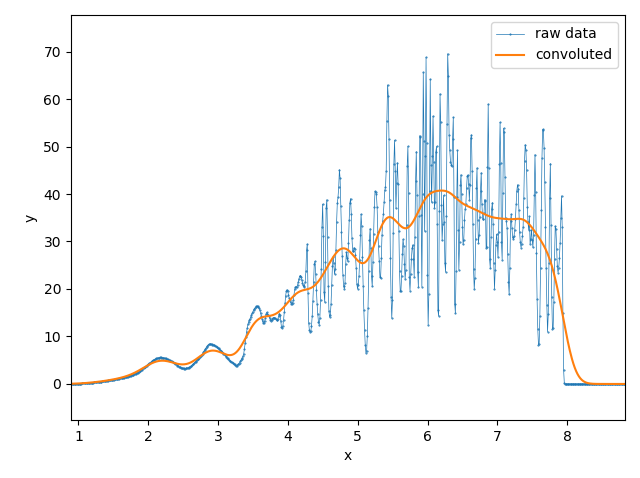
Smoothing by convolution with Gauss function
Download script from .\convolution.py
import sys
import csv
import matplotlib.pyplot as plt
from math import sqrt, exp, pi
import matplotlib.pyplot as plt
"""
Smoothing by convolution with Gauss function
"""
#======================
# parameters
#======================
csvfile = 'dos.csv'
outfile = 'convolution.csv'
width = 0.2
argv = sys.argv
n = len(argv)
if n >= 2:
width = float(argv[1])
def convolution(x, y, width):
ndata = len(x)
dx = x[1] - x[0]
xrange = x[ndata-1] - x[0]
# integration range, converted to number of the list index
di = int( (width * 5.0) / dx + 1.1 )
# the coefficient of Gauss function
coeff = 1.0 / sqrt(pi)/ width
# deconvoluted data
ys = [0.0]*ndata
for j in range(0, ndata):
x0 = x[j];
y0 = y[j];
for k in range(-di, di+1):
if j+k < 0 or j+k >= ndata:
continue
dvx = dx * k / width
f = dx * coeff * exp(-dvx*dvx)
ys[j+k] += y0 * f
return ys;
def savecsv(outfile, x, y, ys):
try:
print("Write to [{}]".format(outfile))
f = open(outfile, 'w')
except:
# except IOError:
print("Error: Can not write to [{}]".format(outfile))
else:
fout = csv.writer(f, lineterminator='\n')
fout.writerow(('x', 'y(raw)', 'y(smooth)'))
# fout.writerows(data)
for i in range(0, len(x)):
fout.writerow((x[i], y[i], ys[i]))
f.close()
def main():
global csvfile
global outfile
global width
print("Read data from [{}]".format(csvfile))
x = []
y = []
with open(csvfile) as f:
fin = csv.reader(f)
next(fin)
c = 0
for row in fin:
if c == 0:
label = row
print("{}\t{}".format(label[0], label[1]))
else:
print("{}\t{}".format(row[0], row[1]))
x.append(float(row[0]))
y.append(float(row[1]))
c += 1
ndata = len(x)
print("")
print("Smoothing by convolution with Gauss function of w = {}".format(width))
ys = convolution(x, y, width)
for i in range(0, ndata):
print("{}\t{}\t{}".format(x[i], y[i], ys[i]))
savecsv(outfile, x, y, ys)
print("")
#=============================
# Plot graphs
#=============================
fig = plt.figure()
ax1 = fig.add_subplot(1, 1, 1)
ax1.plot(x, y, label = 'raw data', linestyle = '-', linewidth = 0.5, marker = 'o', markersize = 0.5)
ax1.plot(x, ys, label = 'convoluted')
ax1.set_xlabel("x")
ax1.set_ylabel("y")
ax1.legend()
plt.tight_layout()
plt.pause(0.1)
print("Press ENTER to exit>>", end = '')
input()
exit()
if __name__ == '__main__':
main()


