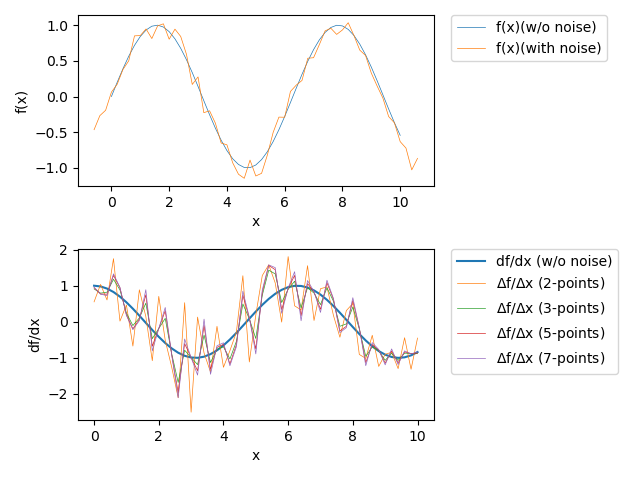
Effect of different approxmations for numerical differentiation with noise
Download script from .\diff_order_noise.py
import csv
import numpy as np
from math import exp, sin, cos
from random import random, uniform
from matplotlib import pyplot as plt
"""
Effect of different approxmations for numerical differentiation with noise
"""
# define function to be differentiated
def func(x):
return sin(x)
# define analytical deviation of f(x)
def dfdx(x):
return cos(x)
def make_data(x0, xstep, nx, noise):
xa = []
ya = []
for i in range(-3, nx+3):
x = x0 + i * xstep
xa.append(x)
ya.append(func(x) + noise * (np.random.rand() - 0.5) * 2.0)
# ya.append(func(x) + noise * (random() - 0.5) * 2.0)
# ya.append(func(x) + noise * uniform())
return xa, ya
# numerical differentiation by two-point forward difference method
def diff2forward(x, y, i):
n = len(x)
if(0 <= i <= n-2):
return (y[i+1] - y[i]) / (x[i+1] - x[i]);
return ''
def diff2backward(x, y, i):
n = len(x)
if(1 <= i <= n-1):
return (y[i] - y[i-1]) / (x[i] - x[i-1]);
return ''
def diff3(x, y, i):
n = len(x)
if(1 <= i <= n-2):
return (y[i+1] - y[i-1]) / 2.0 / (x[i] - x[i-1]);
return ''
def diff5(x, y, i):
n = len(x)
if(2 <= i <= n-3):
return (-y[i+2] + 8.0*y[i+1] - 8.0*y[i-1] + y[i-2]) / 12.0 / (x[i] - x[i-1]);
return ''
def diff7(x, y, i):
n = len(x)
if(3 <= i <= n-4):
return (y[i+3] - 9.0*y[i+2] + 45.0*y[i+1]
- 45.0*y[i-1] + 9.0*y[i-2] - y[i-3]) / 60.0 / (x[i] - x[i-1]);
return ''
#===================
# parameters
#===================
outfile = 'diff_order_noise.csv'
x0 = 0.0
xstep = 0.2
nx = 51
noise = 0.2
#===================
# main routine
#===================
def main():
print("Numerical differentiation using differnet approximations")
print("Write to [{}]".format(outfile))
xa, ya = make_data(x0, xstep, nx, noise)
# open outfile to write a csv file
f = open(outfile, 'w')
fout = csv.writer(f, lineterminator='\n')
fout.writerow([
'x', 'f(x)', 'f+noise', 'df/dx',
'Df/Dx(2-point)',
'Df/Dx(3-point)',
'Df/Dx(5-point)',
'Df/Dx(7-point)'
])
print("")
print("{:^6}:\t{:^10}\t{:^10}\t{:^10}\t"
"{:^10}\t{:^10}\t{:^10}\t{:^10}"
.format(
'x', 'f(x)', 'f+noise', 'df/dx',
'Df/Dx(2-point)',
'Df/Dx(3-point)',
'Df/Dx(5-point)',
'Df/Dx(7-point)'
))
xx = []
yf = []
yf1 = []
ydiff2 = []
ydiff3 = []
ydiff5 = []
ydiff7 = []
for ix in range(3, nx+3):
idx = ix - 3
x = xa[ix]
y = ya[ix]
xx.append(x)
yf.append(func(x))
yf1.append(dfdx(x))
ydiff2.append(diff2forward(xa, ya, ix))
ydiff3.append(diff3(xa, ya, ix))
ydiff5.append(diff5(xa, ya, ix))
ydiff7.append(diff7(xa, ya, ix))
print("{:^5.3f}:\t{:^10.4f}\t{:^10.4f}\t{:^10.4f}\t".format(x, y, yf[idx], yf1[idx]), end = '')
print("{:^10.4f}\t{:^10.4f}\t{:^10.4f}\t{:^10.4f}\t".format(
ydiff2[idx], ydiff3[idx], ydiff5[idx], ydiff7[idx]), end = '')
print("")
fout.writerow([x, y, yf[idx], yf1[idx], ydiff2[idx], ydiff3[idx], ydiff5[idx], ydiff7[idx]])
f.close()
#=============================
# Plot graphs
#=============================
fig = plt.figure()
ax1 = fig.add_subplot(2, 1, 1)
ax2 = fig.add_subplot(2, 1, 2)
ax1.plot(xx, yf, label = 'f(x)(w/o noise)', linewidth = 0.5)
ax1.plot(xa, ya, label = 'f(x)(with noise)', linewidth = 0.5)
ax1.set_xlabel("x")
ax1.set_ylabel("f(x)")
ax1.legend(bbox_to_anchor=(1.05, 1.0), loc='upper left', borderaxespad = 0)
ax2.plot(xx, yf1, label = 'df/dx (w/o noise)')
ax2.plot(xx, ydiff2, label = '$\Delta$f/$\Delta$x (2-points)', linewidth = 0.5)
ax2.plot(xx, ydiff3, label = '$\Delta$f/$\Delta$x (3-points)', linewidth = 0.5)
ax2.plot(xx, ydiff5, label = '$\Delta$f/$\Delta$x (5-points)', linewidth = 0.5)
ax2.plot(xx, ydiff7, label = '$\Delta$f/$\Delta$x (7-points)', linewidth = 0.5)
ax2.set_xlabel("x")
ax2.set_ylabel("df/dx")
ax2.legend(bbox_to_anchor=(1.05, 1.0), loc='upper left', borderaxespad = 0)
plt.tight_layout()
plt.pause(0.1)
print("Press ENTER to exit>>", end = '')
input()
if __name__ == '__main__':
main()

