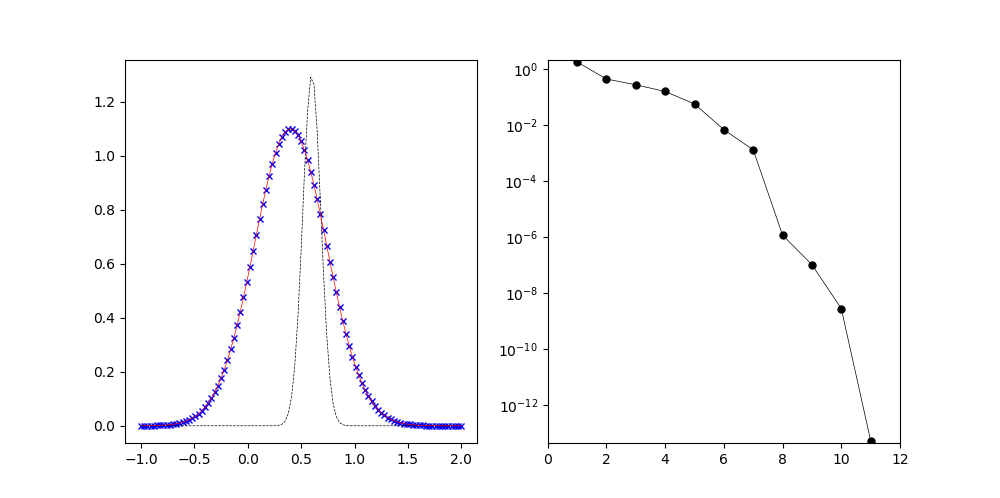
非線形最適化 scipy.minimize()を用いたピークフィッティング
Download script from .\peakfit-scipy-minimize.py
import numpy as np
from math import exp
from scipy.optimize import minimize
import matplotlib.pyplot as plt
"""
非線形最適化 scipy.minimize()を用いたピークフィッティング
"""
#========================================================
# scipy.minimize()で使える最適化アルゴリズム
# ここでは共役勾配法(cg)を選択
#========================================================
#nelder-mead Downhill simplex
#powell Modified Powell
#cg conjugate gradient (Polak-Ribiere method)
#bfgs BFGS法
#newton-cg Newton-CG
#trust-ncg 信頼領域 Newton-CG 法
#dogleg 信頼領域 dog-leg 法
#L-BFGS-B’ (see here)
#TNC’ (see here)
#COBYLA’ (see here)
#SLSQP’ (see here)
#trust-constr’(see here)
#dogleg’ (see here)
#trust-exact’ (see here)
#trust-krylov’ (see here)
method = "cg"
maxiter = 100
tol = 1.0e-5
#==========================================
# Source parameters to be fitted
#==========================================
# フィッティング対象のプロファイル関数のパラメータ: I0, x0, w
peaks = [1.1, 0.4, 0.4]
nparams = len(peaks)
xrange = [-1.0, 2.0]
nx = 101
xstep = (xrange[1] - xrange[0]) / (nx - 1)
xd = []
for i in range(nx):
xd.append(xrange[0] + i * xstep)
yd = []
# 最適化変数の初期値
x0 = [1.3, 0.6, 0.1]
#==========================================
# Graph parameters
#==========================================
fplot = 1
ngdata = 51
xgmin = -4.0
xgmax = 4.0
ygmin = -4.0
ygmax = 4.0
tsleep = 0.3
#==========================================
# functions
#==========================================
# 与えられた変数 params と、座標 x におけるプロファイル関数の値
def ycal(x, params):
ret = 0.0
for ip in range(0, len(params), 3):
I0 = params[ip]
x0 = params[ip+1]
w = params[ip+2]
if w < 0.001:
w = 0.001
a = 0.832554611 / w
X = a * (x - x0)
ret += I0 * exp(-X * X)
return ret
def ycal_list(xd, params):
print("pa=", params)
y = []
for i in range(len(xd)):
y.append(ycal(xd[i], params))
return y
# 最小化する目的関数。残差二乗和
def CalS2(params):
global xd, yd, nx
S2 = 0.0
for i in range(nx):
yc = ycal(xd[i], params)
d = yd[i] - yc
S2 += d * d
return S2
# i番目の最適化変数による一次微分。SIMPLEX法では使わない
def diff1i(i, params):
global xd, yd, nx
ip = i // 3
idx = i % 3
I0 = params[ip*3]
x0 = params[ip*3+1]
w = params[ip*3+2]
ret = 0.0
for id in range(nx):
if w < 0.001:
w = 0.001
yc = ycal(xd[id], [I0, x0, w])
dy = yd[id] - yc
a = 0.832554611 / w
dx = a * (xd[id] - x0)
e = exp(-dx*dx)
if idx == 0: # I0
dif = e
elif idx == 1: # x0
dif = 2.0 * a * dx * I0 * e
elif idx == 2: # w
dif = 2.0 * dx * dx / w * I0 * e
else:
print("Error in diff1i: Invalid index (ivar={}, ipeak={}, diff_idx={})".format(i, ip, idx))
exit()
d = -2.0 * dif * dy
ret += d
return ret
# 一次微分関数配列。SIMPLEX法では使わない
def diff1(params):
global nparams
df = np.empty(len(params))
for i in range(len(params)):
df[i] = diff1i(i, params)
return df
# 最適化の各サイクルごとに呼び出されるコールバック関数
# callbackへは変数の値しか渡されないので、他に必要な変数は
# global変数として渡す
iter = 0
xiter = []
yfmin = []
figure = None
ax_fit = None
rawdata = None
inidata = None
fitdata = None
ax_conv = None
convdata = None
def callback(xk):
global xd
global iter
global figure, ax_fit, ax_conv
global fitdata, convdata
fmin = CalS2(xk)
print("callback {}: xk={}".format(iter, xk))
print(" fmin={}".format(fmin))
iter += 1
xiter.append(iter)
yfmin.append(fmin)
convdata[0].set_data(xiter, yfmin)
ax_conv.set_xlim((0.0, max(xiter) + 1.0))
ax_conv.set_ylim((min(yfmin) * 0.8, max(yfmin) * 1.2))
yc = ycal_list(xd, xk)
fitdata[0].set_data(xd, yc)
plt.pause(0.2)
#==========================================
# Main routine
#==========================================
def main():
global xd, yd, xiter, yfmin
global figure, ax_fit, ax_conv
global fitdata, convdata
print("")
print("Peak fitting by python scipy.optimize")
yd = ycal_list(xd, peaks)
yini = ycal_list(xd, x0)
#グラフを描画
if fplot == 1:
figure = plt.figure(figsize = (10, 5))
ax_fit = figure.add_subplot(1, 2, 1)
rawdata = ax_fit.plot(xd, yd, color = 'blue', linestyle = '', linewidth = 0.5,
fillstyle = 'full', marker = 'x', markersize = 5)
inidata = ax_fit.plot(xd, yini, color = 'black', linestyle = 'dashed', linewidth = 0.5)
fitdata = ax_fit.plot([], [], color = 'red', linestyle = '-', linewidth = 0.5)
ax_conv = figure.add_subplot(1, 2, 2)
ax_conv.set_yscale('log')
convdata = ax_conv.plot([], [], color = 'black', linestyle = '-', linewidth = 0.5,
fillstyle = 'full', marker = 'o', markersize = 5)
plt.pause(0.001)
#scipy.minimize()による最適化
res = minimize(CalS2, x0, jac=diff1, method=method, tol = tol, callback = callback,
options = {'maxiter':maxiter, "disp":True})
#最適化結果の表示
print(res)
if fplot == 1:
print("Press ENTER to terminate:", end = '')
ret = input()
if __name__ == "__main__":
main()