import csv
from pprint import pprint
from math import sqrt
import numpy as np
from scipy import optimize
from matplotlib import pyplot as plt
"""
scipy.optimize.leastsqを使って多項式最小二乗の結果をグラフにプロット
フィッティング範囲を起動時引数で変える
"""
#=============================
# 大域変数の定義
#=============================
# CSVファイル
infile = 'data.csv'
# フィッティングパラメータ初期値。線形最小二乗の場合は適当
ai0 = [0, 0, 0]
fitrange = [-1e10, 1e10]
# グラフのフォントサイズ
fontsize = 24
# 起動時引数でフィッティング範囲を変更
argv = sys.argv
print("argv=", argv)
if len(argv) >= 2:
fitrange[0] = float(argv[1])
if len(argv) >= 3:
fitrange[1] = float(argv[2])
print("")
print("fitting range: ", fitrange)
#=============================
# 最小化する関数の定義
#=============================
def ycal(ai, x):
return ai[0] + ai[1] * x + ai[2] * x * x
def residual(ai, x, y):
res = []
for i in range(len(x)):
res.append(y[i] - ycal(ai, x[i]))
return res
#=============================
# csvファイルの読み込み
#=============================
i = 0
x = []
y = []
with open(infile, "r") as f:
reader = csv.reader(f)
for row in reader:
if i == 0:
header = row
else:
xi = float(row[0])
if fitrange[0] <= xi <= fitrange[1]:
x.append(xi)
y.append(float(row[1]))
i = i + 1
print("")
print("CSV data:")
print(" header:", header)
print(" x:", x)
print(" y:", y)
#=============================
# scipy.optimize()による最小化
#=============================
print("")
print("polynomial fit by scipy.optimize() start:")
# leastsqの戻り値は、最適化したパラメータのリストと、最適化の結果
ai, cov_x, inf, mesg, ier = optimize.leastsq(residual, ai0, args= (x, y), full_output = True)
print(" lsq result: ai=", ai)
res = sqrt(sum(inf['fvec']*inf['fvec']) / len(x))
print(" residual=", res)
print(" y = {} + {} * x + {} * x^2".format(ai[0], ai[1], ai[2]))
#=============================
# グラフの表示
#=============================
#表示データの作成
xmin = min(x)
xmax = max(x)
ncal = 100
xstep = (xmax - xmin) / (ncal - 1)
xc = []
yc = []
for i in range(ncal):
xi = xmin + i * xstep
yi = ycal(ai, xi)
xc.append(xi)
yc.append(yi)
#グラフの作成、表示
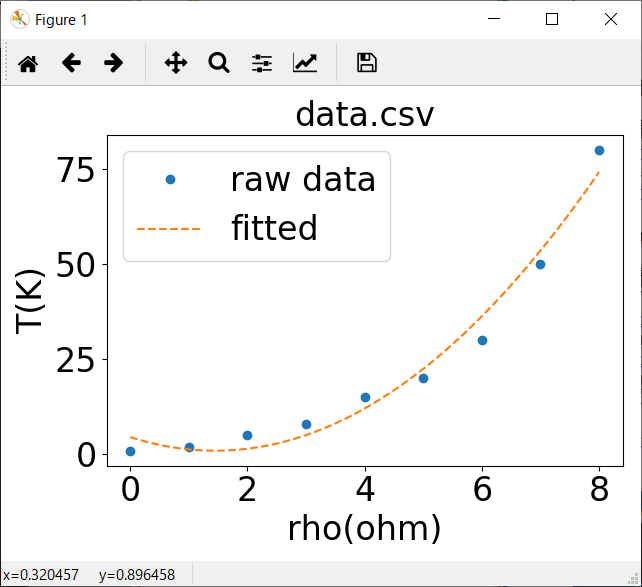
plt.plot(x, y, label='raw data', marker = 'o', linestyle = 'None')
plt.plot(xc, yc, label='fitted', linestyle = 'dashed')
plt.title(infile, fontsize = fontsize)
plt.xlabel(header[0], fontsize = fontsize)
plt.ylabel(header[1], fontsize = fontsize)
plt.legend(fontsize = fontsize)
plt.tick_params(labelsize = fontsize)
plt.tight_layout()
plt.show()