Warning: Can not open [/home/conf/public_html/cgi-bin/show_python.log]. Ignore
No title
Download script from distribution_function.py
Related files:
import numpy as np
from numpy import exp, log, sin, cos, tan, arcsin, arccos, arctan, pi
from matplotlib import pyplot as plt
e = 1.602176634e-19 # C";
kB = 1.380649e-23 # JK-1";
figsize = (12, 8)
fontsize = 20
legend_fontsize = 16
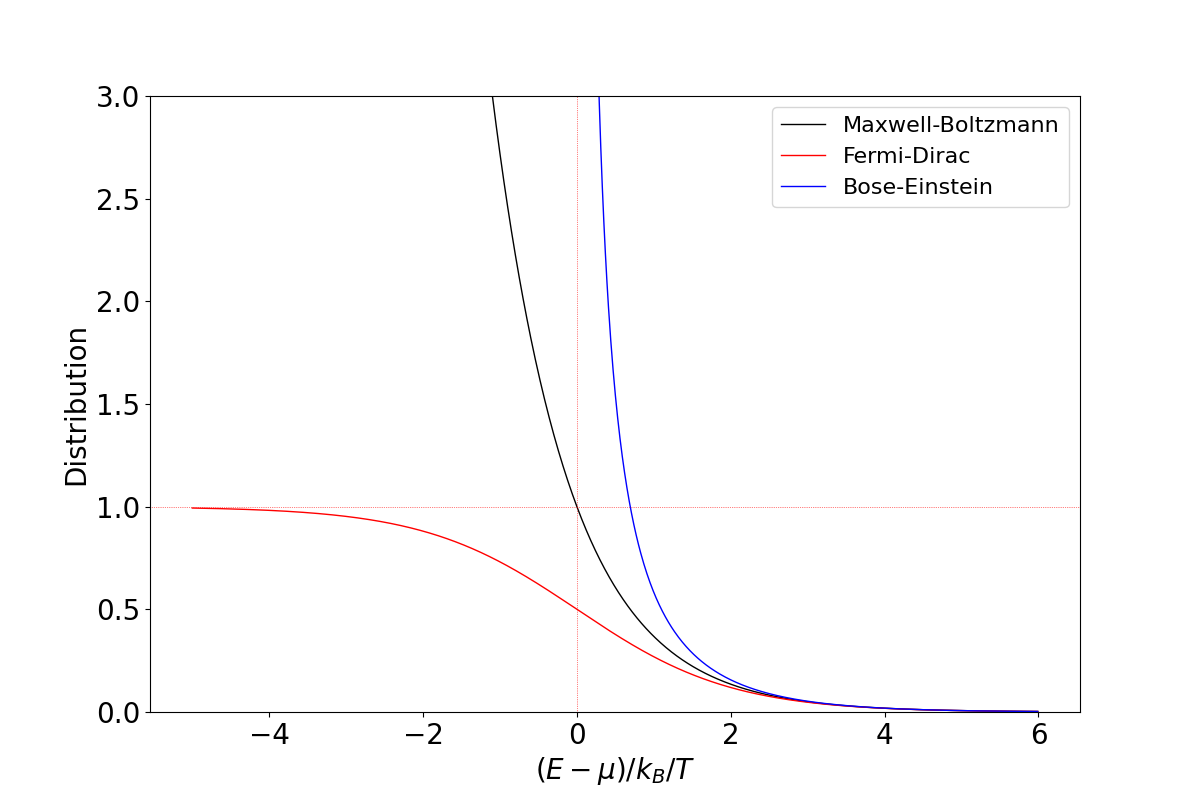
E_MB = np.arange(-5.0, 6.0, 0.01) # eV
MB = [exp(-E) for E in E_MB]
E_FD = np.arange(-5.0, 6.0, 0.01) # eV
FD = [1.0 / (exp(E) + 1.0) for E in E_FD]
E_BE = np.arange(0.01, 6.0, 0.01) # eV
BE = [1.0 / (exp(E) - 1.0) for E in E_BE]
fig, axes = plt.subplots(1, 1, figsize = figsize)
ax = axes
ax.tick_params(labelsize = fontsize)
ax.plot(E_MB, MB, label = 'Maxwell-Boltzmann', color = 'black', linewidth = 1.0)
ax.plot(E_FD, FD, label = 'Fermi-Dirac', color = 'red', linewidth = 1.0)
ax.plot(E_BE, BE, label = 'Bose-Einstein', color = 'blue', linewidth = 1.0)
ax.set_xlabel(r'($E - \mu) / k_B / T$', fontsize = fontsize)
ax.set_ylabel('Distribution', fontsize = fontsize)
ax.set_ylim([0.0, 3.0])
ax.axhline(1.0, linestyle = 'dotted', color = 'red', linewidth = 0.5)
ax.axvline(0.0, linestyle = 'dotted', color = 'red', linewidth = 0.5)
ax.legend(fontsize = legend_fontsize)
plt.savefig('distribution_function.png')
plt.pause(0.0001)
input("\nPress ENTER to terminate>>")

