Warning: Can not open [/home/conf/public_html/cgi-bin/show_python.log]. Ignore
No title
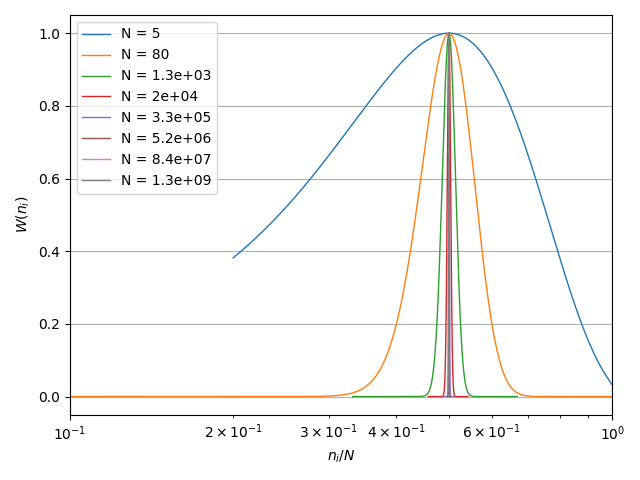
Download script from plotW.py
Related files:
import matplotlib.pyplot as plt
import numpy as np
from numpy import log, exp, sqrt
N_values = [5.0 * 2**i for i in range(0, 32, 4)]
def W(N, ni):
lnW_max = N * log(N) - 2.0 * N / 2.0 * log(N / 2.0)
W_list = []
for _ni in ni:
ni_t = _ni * log(_ni) if _ni > 0 else 0
Nni_t = (N - _ni) * log(N - _ni) if N - _ni > 0 else 0
lnW = N * log(N) - ni_t - Nni_t - lnW_max
W_list.append(exp(lnW))
return W_list
plt.title('# of configrations ($_NC_{n_i}$)')
fig, ax = plt.subplots()
for N in N_values:
N_avg = N * 0.5
Nrange = 6.0 * sqrt(N)
logni = np.linspace(log(max([1.0, N_avg - Nrange])), log(N_avg + Nrange), 500)
ni = exp(logni)
W_ni = W(N, ni)
x = ni / N
# W_ni /= max(W_ni)
ax.plot(x, W_ni, label = f'N = {N:.2g}', linewidth = 1.0)
ax.set_xlabel('$n_i / N$')
ax.set_ylabel('$W(n_i)$')
ax.set_xlim([0.1, 1.0])
ax.set_xscale('log')
#ax.set_yscale('log')
#for tick in ax.get_xticklabels():
# tick.set_rotation(45)
ax.legend()
plt.grid(True)
plt.tight_layout()
plt.savefig('plotW.png')
plt.pause(0.1)
input(">>")

